Why Does Solar Power Cost So Much for Global Buyers?
Solar panels look cheaper than ever, yet many buyers still face surprisingly high project bills. The phrase “solar power cost” includes more than the panel itself. It covers land, inverters, mounting systems, grid connections, insurance, financing, and skilled labor. A container of modules may cross an ocean cheaply, while a delayed transmission upgrade quietly adds millions.
IRENA’s Renewable Power Generation Costs in 2023 reported a global average utility-scale solar photovoltaic cost of USD 0.044 per kilowatt-hour. That represented a 12% decline from 2022. Lazard’s Levelized Cost of Energy Analysis, version 17.0, placed unsubsidized utility-scale solar between USD 29 and USD 92 per megawatt-hour. These figures look encouraging. However, they describe different markets and assumptions. They are not retail electricity prices.
Financing often changes the final answer. Projects in markets with higher interest rates can pay much more, even when equipment prices match China or Europe. Currency movements, tariffs, local-content rules, and weak grid infrastructure add further pressure. Storage can also raise the delivered cost when buyers need power after sunset. The IEA has repeatedly highlighted supply-chain concentration and grid bottlenecks as important energy-transition risks.
The comparison is imperfect. A global average cannot capture every rooftop, warehouse, or remote village. Still, it reveals the central problem: cheaper technology does not automatically mean cheaper electricity. Buyers must examine the full project pathway, not only the panel quotation. That detail is easy to miss.
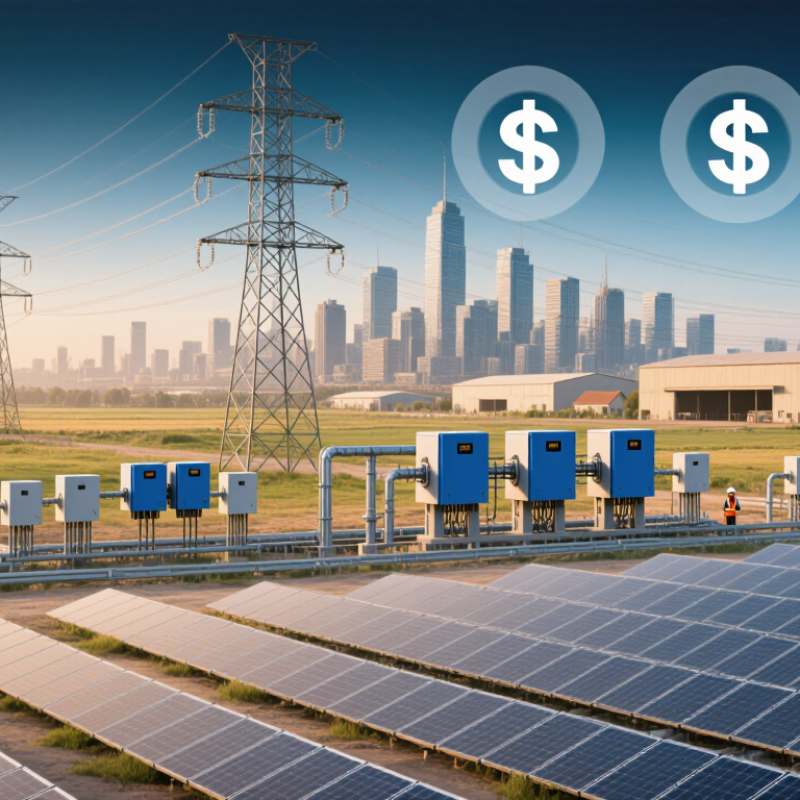
Solar power costs differ widely because the panel is only one part of the project. IRENA’s Renewable Power Generation Costs in 2023 reported a global weighted-average utility-scale solar PV cost of about $44 per megawatt-hour. That figure excludes many local complications. It is not a universal price.
Financing often changes the answer most. A project with expensive debt can produce costly electricity, even when its equipment is cheap. The IEA’s World Energy Investment 2024 report shows that financing conditions remain much harsher in emerging markets than in advanced economies. Currency risk can add another hidden charge. A buyer may pay in dollars, while earning revenue in a weaker local currency.
Hardware prices matter, but logistics and construction matter too. The IEA PVPS Trends in Photovoltaic Applications 2024 report noted severe module price declines during 2023, partly because global manufacturing capacity exceeded demand. Yet cheap modules do not remove shipping, insurance, customs, land preparation, or grid-connection costs. Rocky ground can require stronger foundations. A distant substation can delay construction for months. Transmission congestion may also force curtailment after completion.
Small details become expensive.
Lazard’s Levelized Cost of Energy analysis places utility-scale solar costs in a broad range, roughly $29 to $92 per megawatt-hour in its 2024 edition. Such comparisons are useful, but imperfect. They often assume different lifetimes, financing rates, and operating conditions. Buyers should question the headline number, inspect every assumption, and measure delivered electricity rather than panel prices alone.
The global weighted-average levelized cost of electricity (LCOE) from utility-scale solar photovoltaic projects fell from approximately $0.460/kWh in 2010 to $0.044/kWh in 2023. However, the final price paid by buyers can differ because of financing costs, local labor and land prices, grid connection requirements, taxes, import rules, solar irradiation, and project scale.
Source: International Renewable Energy Agency (IRENA), Renewable Power Generation Costs 2023. Values are global weighted-average utility-scale solar PV LCOE in 2023 US dollars per kWh.
Solar panels are cheaper than they appear because their prices reflect more than factory output. Polysilicon becomes wafers, cells, and modules through several energy-intensive stages. Glass, aluminum frames, copper, silver, and protective films add further cost. The International Energy Agency reported that solar module prices fell by almost 50% in 2023, partly because manufacturing capacity exceeded demand. Yet low factory prices do not reach every buyer equally.
Shipping routes, import duties, insurance, and local certification can reshape the final invoice. A container delayed at a port may increase project costs without changing the panel itself. Financing matters even more for large installations. Higher interest rates raise the cost of every megawatt built. The International Renewable Energy Agency found that utility-scale solar’s global weighted-average electricity cost fell to about USD 0.044 per kilowatt-hour in 2023. That decline is significant, but it does not erase regional differences.
Materials still create uncertainty. Silver use per cell is falling, but copper, glass, and aluminum demand remains substantial. The IEA’s Global Critical Minerals Outlook 2024 warns that clean-energy supply chains remain geographically concentrated. This creates exposure to price shocks and transport disruptions. My own reading of procurement data suggests one weakness: analysts often compare module prices, not complete delivered systems. That comparison is incomplete. Labor, land, grid connection, storage, and financing can cost more than the panels themselves.
| Cost or Market Dimension | Indicative Value | Unit / Period | How It Influences Global Prices | Reference Basis |
|---|---|---|---|---|
| Utility-scale module selling price | US$0.10–0.20 | Per watt, 2024 indicative range | Factory-gate prices are lowest in highly integrated supply chains. Imported modules can become more expensive after freight, duties, insurance, financing, and certification. | International solar-market price reporting and 2024 industry benchmarks |
| Polysilicon price | US$5–12 | Per kilogram, 2024 indicative range | Polysilicon is the basic feedstock for crystalline-silicon wafers. Capacity shortages can raise wafer, cell, and module costs, while oversupply can sharply reduce them. | Public photovoltaic commodity-price assessments for 2024 |
| Silicon consumption in a modern module | Approximately 2.5–3.5 | Grams per watt | Lower silicon use per watt reduces material costs. Wafer thickness, cell efficiency, kerf loss, and production technology all affect the final quantity required. | Engineering ranges reported in photovoltaic technology roadmaps |
| Silver consumption for cell metallization | Approximately 10–20 | Milligrams per watt | Silver is used in electrical contacts. Although its mass is small, price volatility can influence cell costs, encouraging copper substitution and thinner silver lines. | Photovoltaic metallization and material-use studies |
| Solar glass requirement | Approximately 10–14 | Kilograms per square metre of module area | Glass is a major physical input. Energy-intensive melting, limited local production, and high transport weight can increase delivered module prices. | Typical 2.0–3.2 mm tempered or bifacial-module glass specifications |
| Aluminium frame material | Approximately 0.3–0.6 | Kilograms per standard module | Aluminium prices, extrusion capacity, energy costs, and recycled-content requirements affect frame costs. Frameless designs can reduce material use but may require different mounting systems. | Typical crystalline-silicon module bill-of-materials ranges |
| Module freight and insurance | Approximately 5–15% | Share of delivered module cost | Ocean distance, container availability, fuel prices, port congestion, packaging, and inland transport can create large differences between factory-gate and buyer prices. | Typical logistics ranges for international containerized module delivery |
| Import duties and trade measures | 0–50% or more in affected markets | Additional charge, depending on product and jurisdiction | Tariffs, safeguard measures, anti-dumping actions, and local-content rules can raise the buyer price even when global manufacturing costs are falling. | Applicable national customs schedules and trade-remedy regulations |
| Balance-of-system cost | US$0.15–0.45 | Per watt for utility-scale projects, excluding financing | Racking, inverters, cabling, transformers, civil works, monitoring, and installation can cost as much as or more than the modules themselves. | International utility-scale photovoltaic cost benchmarks |
| Financing and development cost | Approximately 10–30% | Share of total project cost in many markets | Interest rates, currency risk, permitting delays, grid-connection uncertainty, insurance, and the cost of capital can outweigh changes in module prices. | Renewable-energy project-finance and levelized-cost assessments |
| Global module price transmission delay | Several weeks to several months | Typical market adjustment period | Existing inventories, long-term contracts, shipping schedules, currency movements, and local certification requirements delay the pass-through of falling factory prices to buyers. | Observed supply-chain behavior in international photovoltaic markets |
Note: Values are indicative international ranges rather than quotations. Actual prices vary by technology, order volume, delivery terms, local taxes, exchange rates, project scale, and market regulations.
Solar power often looks inexpensive at the factory gate. The final price can tell a different story. Buyers pay for more than panels, inverters, and mounting equipment.
Manufacturing begins with energy-intensive materials, including refined silicon, glass, aluminum, and copper. Each stage requires machinery, skilled labor, testing, and quality controls. A small defect can reduce output for years, so reliable production carries a real cost.
Trade adds another layer. Import duties, customs processing, inspections, insurance, and currency changes can raise the delivered price. Different countries also require different certifications. Compliance takes time and technical documentation. That time is rarely free.
Shipping is especially visible in project budgets. A container may cross several ports before reaching a remote installation site. Fuel prices, port congestion, seasonal demand, and equipment shortages can change freight costs quickly. Oversized components may need special handling or inland transport. A delayed shipment can also keep workers and equipment idle.
Many price comparisons miss these practical details. They compare factory quotes instead of complete delivery costs. That approach is convenient, but incomplete. It can make solar appear cheaper than it really is for a specific market.
The calculation is not always elegant. Local labor, grid connection work, financing, and replacement planning may matter even more than transport. Buyers should request a transparent landed-cost estimate, check supplier documentation, and leave room for uncertainty. Cost assumptions can fail. Good planning admits that.
Solar modules are cheaper than ever, yet global buyers often pay much more than factory prices suggest. IRENA’s Renewable Power Generation Costs 2023 reports that utility-scale solar’s global weighted-average electricity cost fell to about $0.044 per kilowatt-hour. However, local policies can add import duties, sales taxes, land charges, and lengthy approval expenses. A cheap panel is not a cheap project.
Infrastructure creates another cost layer. The IEA’s Electricity Grids and Secure Energy Transitions report estimates that annual grid investment must rise from roughly $300 billion to over $600 billion by 2030. In regions with weak transmission networks, buyers may fund new substations, backup systems, or expensive grid connections.
Delays also matter. Equipment can sit in a port while permits remain unfinished. Policy is physical.
Financing may be the largest hidden difference. IRENA’s 2023 cost analysis shows that the cost of capital strongly changes solar project economics, even when equipment prices are similar. Higher interest rates, currency risk, and uncertain contracts increase monthly payments for buyers. This comparison is imperfect, because reported costs rarely capture every local delay. Still, it reveals a practical truth: buyers purchase electricity systems, not panels alone. Local rules, grid readiness, and lender confidence can decide whether solar feels affordable.
Solar electricity is cheaper than ever, yet buyers rarely pay one universal price. IRENA’s Renewable Power Generation Costs in 2023 reported a global utility-scale solar PV cost of about $0.044 per kilowatt-hour. That figure hides major regional differences. A solar farm in a sunny desert may produce power efficiently. A rooftop in a cloudy city may need more panels, stronger structures, and longer installation hours.
Financing often creates the sharpest gap. A project using loans at 4% interest faces a very different cost from one borrowing at 10%. The World Bank identifies financing conditions, grid access, land, and policy risk as important drivers of renewable investment costs. Currency movements also matter. Imported panels, inverters, and cables become more expensive when the local currency weakens. A $1,000 module is not a $1,000 project. Transport, customs duties, engineering, insurance, and grid upgrades can multiply the final bill.
IEA PVPS Trends in Photovoltaic Applications 2024 recorded more than 400 gigawatts of new solar capacity added globally in 2023. Scale is improving supply chains, but not evenly. Some regions still face port delays, limited skilled labor, and unstable permitting. This picture is not perfectly clean. Reported costs also use different assumptions about land, system life, and financing. Comparing countries without checking those assumptions can mislead buyers. The cheapest sunlight does not always produce the cheapest electricity.
Our mission is to develop cutting-edge clean energy technology and provide next-generation solar inverters.
(888) 598-9901
nep-usa@site_ea168614-f5f4-4298-bd5b-880b4cf8d99d