- Spanish-Latin America
- Japanese-JP
- Chinese
- Europe
- Português-BR

Tech Support
(888) 598-9901
Hours: Mon-Fri 8AM-8PM EST
nep-usa@site_ea168614-f5f4-4298-bd5b-880b4cf8d99d
2026 Best Solar Panels for Electricity Buying Guide
Choosing the right solar panels for electricity is no longer a simple comparison of wattage and price. In 2026, buyers must examine efficiency, temperature performance, warranty terms, degradation rates, and installer quality. A panel that produces impressive power in a laboratory may perform differently under dust, shade, heat, or a winter roof angle.
This guide evaluates leading panel technologies through practical household needs. We consider roof size, daily electricity use, local sunlight, battery compatibility, and long-term maintenance. We also examine manufacturer reliability, third-party testing, product warranties, and real installation experience. Numbers matter, but they do not tell the whole story. A slightly less efficient panel may deliver better value when it fits your roof and budget.
No single panel wins everywhere. That matters. A homeowner in Arizona may prioritize heat resistance, while a family in northern Europe may need strong low-light performance. Our recommendations therefore balance measurable specifications with realistic ownership concerns. We also question common marketing claims, because impressive percentages can hide expensive installation limits. Product availability and incentives may change during 2026, so readers should verify current details with certified installers and official manufacturer documents. This guide aims to make that process clearer, more careful, and easier to compare. Mistakes are still possible, especially when roof shading or future electricity use is underestimated. That is why informed decisions should combine published data, professional advice, and a close look at the actual property.
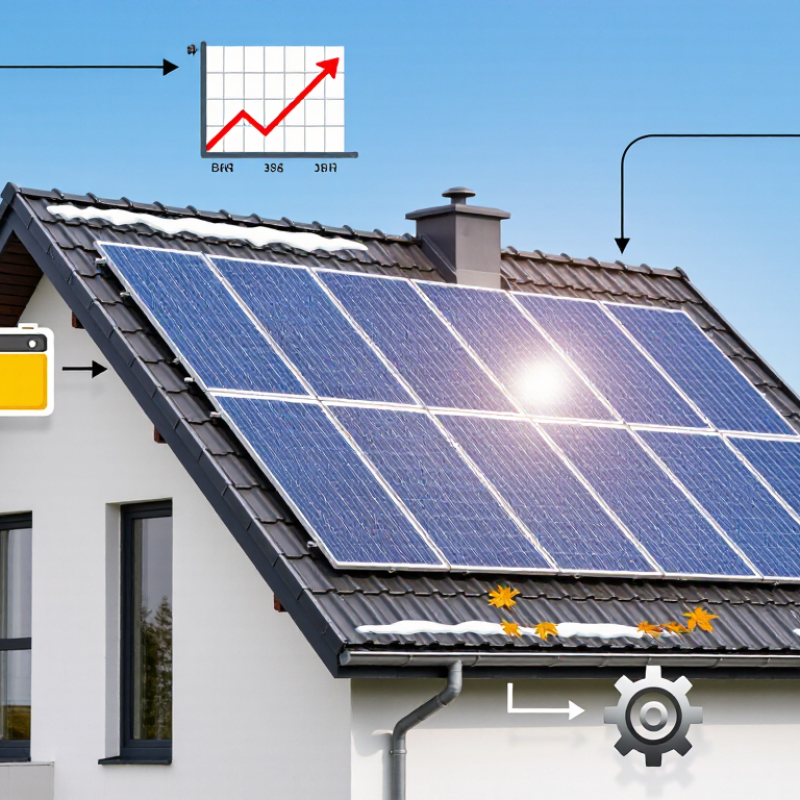
Solar Panel Basics: PV Technologies, Efficiency Ranges, and IEC Standards
Solar Panel Basics: PV Technologies, Efficiency Ranges, and IEC Standards
In 2026, choosing the best solar panel starts with understanding photovoltaic technology, not attractive advertisements. Monocrystalline panels commonly deliver about 19% to 24% efficiency. They suit limited roof space and strong sunlight. Polycrystalline panels often reach roughly 16% to 20%. Thin-film modules can perform better in weak light, but they usually need more roof area. Newer silicon designs may exceed 24% in laboratory conditions. Real installations often produce less.
Efficiency is only one buying measure. Check temperature coefficients, shading behavior, mechanical load ratings, and the product warranty terms. IEC 61215 addresses design qualification and environmental durability testing. IEC 61730 focuses on electrical and fire safety. IEC 62446 supports proper system documentation, inspection, and commissioning. Ask for current test reports, not vague certification language. A qualified installer should also assess roof orientation, local weather, wiring routes, and inverter compatibility. I have seen efficient modules underperform because shade from a small chimney was ignored.
Tips: Compare the panel’s efficiency at its rated conditions, then examine expected output across hot afternoons. Keep installation records and photographs. Inspect the roof first. Cheap estimates can hide difficult repairs. Product testing does not guarantee perfect field performance. That distinction matters. Consider independent engineering advice when the roof is complex or heavily shaded.
2026 Best Solar Panels for Electricity Buying Guide - Solar Panel Basics: PV Technologies, Efficiency Ranges, and IEC Standards
| PV Technology | Typical Commercial Module Efficiency | Typical Temperature Coefficient of Pmax | Typical Annual Degradation | Key Advantages | Main Limitations | Relevant IEC Standards |
|---|---|---|---|---|---|---|
| Monocrystalline silicon, high-efficiency n-type | 21%–24% | Approximately −0.29% to −0.32%/°C | Approximately 0.25%–0.40% per year | High power density; strong performance in limited roof area; reduced light-induced degradation compared with older p-type designs | Higher upfront cost in some markets; performance still decreases at elevated temperatures | IEC 61215, IEC 61730, IEC 61853; IEC 61701 for salt-mist exposure where applicable |
| Monocrystalline silicon, p-type PERC | 19%–22% | Approximately −0.34% to −0.38%/°C | Approximately 0.35%–0.55% per year | Mature manufacturing; widely available; good balance of cost, efficiency, and field experience | Usually lower efficiency and higher degradation than newer n-type designs; may be more affected by light- and elevated-temperature-related degradation | IEC 61215, IEC 61730, IEC 61853; IEC 62804 for PID testing where specified |
| TOPCon silicon | 21%–23.5% | Approximately −0.29% to −0.32%/°C | Approximately 0.25%–0.40% per year | High efficiency; low temperature coefficient; reduced light-induced degradation; suitable for high-output rooftops and utility-scale systems | Manufacturing quality and long-term field data can vary by construction and encapsulation design | IEC 61215, IEC 61730, IEC 61853, IEC 62804 |
| Heterojunction silicon (HJT) | 21%–24% | Approximately −0.24% to −0.29%/°C | Approximately 0.25%–0.35% per year | Very good hot-climate performance; strong low-light response; naturally suited to bifacial designs | May require specialized manufacturing; higher material and production costs are possible | IEC 61215, IEC 61730, IEC 61853, IEC 62804 |
| Bifacial crystalline silicon | 20%–23.5% front-side efficiency | Approximately −0.24% to −0.35%/°C, depending on cell technology | Approximately 0.25%–0.45% per year | Can generate additional rear-side energy from reflected and diffuse light; useful for ground-mount, elevated, and high-albedo installations | Rear-side gain depends strongly on mounting height, spacing, surface reflectivity, shading, and system design | IEC 61215, IEC 61730, IEC 61853-1 and IEC 61853-2 where bifacial performance is evaluated |
| Thin-film CdTe | 17%–20% | Approximately −0.20% to −0.30%/°C | Approximately 0.20%–0.40% per year after initial stabilization | Good high-temperature and diffuse-light performance; suitable for large sites where space is available | Lower power density than high-efficiency crystalline silicon; fewer suppliers and applications in some regions | IEC 61215, IEC 61730, IEC 61853 |
| Thin-film CIGS | 15%–19% | Approximately −0.30% to −0.40%/°C | Approximately 0.30%–0.60% per year after stabilization | Lightweight form factors are possible; good low-light and diffuse-light response | Lower efficiency and limited production scale compared with mainstream crystalline silicon | IEC 61215, IEC 61730, IEC 61853 |
| Dimension | What to Check | Why It Matters |
|---|---|---|
| Module efficiency | Compare efficiency under the same rated test conditions and verify the module power rating | Higher efficiency generally produces more electricity from a limited roof or land area |
| Temperature coefficient | Prefer a less-negative Pmax coefficient for hot climates | Power output normally falls as cell temperature rises above the rated reference temperature |
| Annual degradation | Review the product and performance warranty terms, including the first-year degradation allowance | Lower degradation supports higher lifetime energy production |
| Mechanical load rating | Check front snow-load and rear wind-load ratings against local design requirements | The module and mounting system must be suitable for the site’s wind, snow, and installation conditions |
| Environmental resistance | Look for appropriate testing for salt mist, ammonia, humidity-freeze, and dust exposure when relevant | Environmental stresses can accelerate corrosion, insulation failure, or performance loss |
| Bifacial suitability | Evaluate rear-side irradiance, ground reflectivity, row spacing, and mounting elevation | Bifacial modules provide the greatest benefit when the rear surface receives useful light |
| IEC certification | Confirm current test reports or certificates for IEC 61215 and IEC 61730 from an appropriately recognized laboratory | IEC 61215 addresses design qualification and type approval, while IEC 61730 addresses photovoltaic module safety |
Related Posts
-
Top 10 Green Energy Solar Suppliers for Global Buyers
-
10 Best Green Energy Solar Solutions for a Sustainable Future?
-
What is Green Energy Solar and How Does It Benefit You?
-
7 Best Solar Power for Home Cost Options?
-
Why Are Solar Electric Systems a Smart Investment?
-
Why Choose Solar Electric Energy for Your Home?
Get in touch
Our mission is to develop cutting-edge clean energy technology and provide next-generation solar inverters.
Phone
(888) 598-9901
nep-usa@site_ea168614-f5f4-4298-bd5b-880b4cf8d99d
